While the webui provides graphing I found it lacking for my needs and inconsistent for historical use as graphs have a tendency to disappear during upgrades
I have routers2.cgi running with mrtg and rrdtool on one of my freebsd servers
before running cfgmaker_host from my monitoring server I wanted more than network i/o and that requires some work first on freenas.
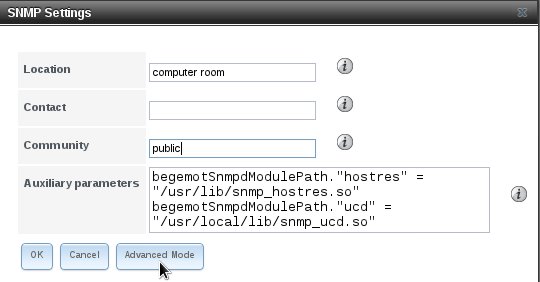
Then you’ll want to set your info and change community string to something other than public and add the auxilary parameters, this will allow routers2 to pull all the disk, process,cpu, memory, load and network stats
Auxillary parameters to add:
begemotSnmpdModulePath.”hostres” = “/usr/lib/snmp_hostres.so”
begemotSnmpdModulePath.”ucd” = “/usr/local/lib/snmp_ucd.so”
Once that’s done you can run cfgmaker_host from the monitoring server wait 10 minutes and you should start getting your graphs


